Print a Biodiversity Report for your area
Biodiversity Maps can generate a report for all species recorded in the system for an area.
Reports can be generated for designated sites, local areas and grid squares.
A simple Step by Step Guide:
1. Open Biodiversity Maps, by typing maps.biodiversityireland.ie In your browser
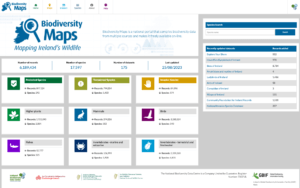
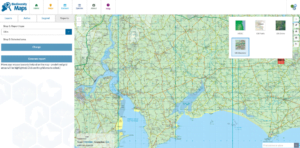
2. Click on ‘Maps’ on the top left of home page
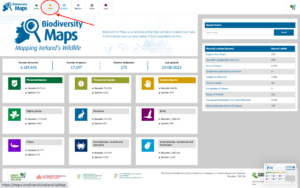
This opens a new window, showing a dynamic mapping pane.
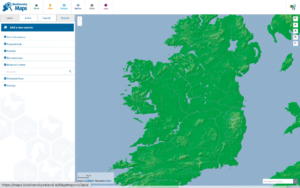
3. Zoom into the general area in which you are interested. For instance this is the general area where the National Biodiversity Data Centre is based in Waterford.
In the panel in the top right corner, you can choose between different base maps.
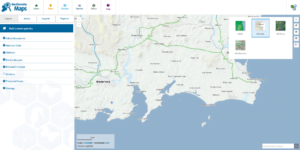
Choose the Discovery series for ease of navigation.
4. Once you have identified the area you want a species report for, click on the ‘Reports’ tab on the sidebar on the left.
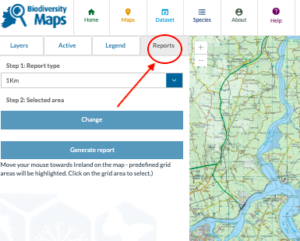
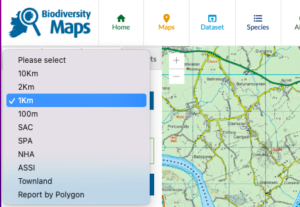
5. Select whether you want a report on 1-km, 2-km, 10-km square level, and so on.
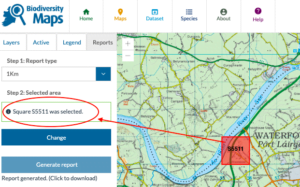
6. Once you have selected the land size for your report, you can see squares highlighted in red as you move your mouse across the map.
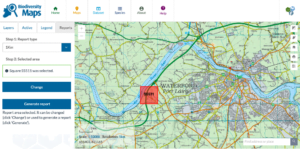
Select the square you are interested in, by clicking on it. The name of this square will now show up on the left hand sidebar:
7. And then just click ‘Generate Report’ on the left hand sidebar.
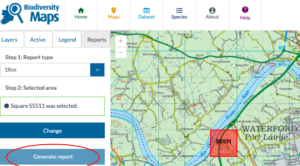
It takes just a few seconds to generate a report, which you can then download.
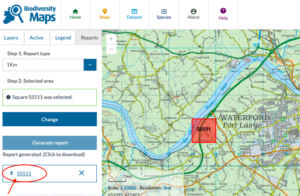
8. The report has been generated when you see the Grid reference number appear here at bottom of left hand sidebar. Click on this to download.
9. The report opens as an Excel file.
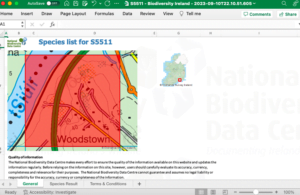
The first sheet shows the map where that 1-km square is located.
Go to the next worksheet, called ‘Species results’, which gives you the output from the data system.
This shows you all the species that have been recorded in your 1-km square.
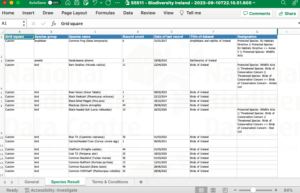
It tells you the species name, the species group it’s from; the number of records in the database for that species; the date of the most recent record for that species in that square; and the title of the dataset from which that record comes. Species are also tagged by their designation. For instance, if a species is a Protected, Threatened or Invasive species, this will be listed in this column.
If you scroll to the bottom of the sheet, you can see how many species have been recorded for the area.
You can explore the species that have been recorded to get more familiar with what biodiversity is in your locality. Some species records might surprise you if they are quite rare. It’s also possible that some of the more common species have not been recorded, so it may prompt you to go out and find some of the species that are missing and submit those records and they will be added to this database.
This short video explains how to generate your area report: